| |
 |
![]()
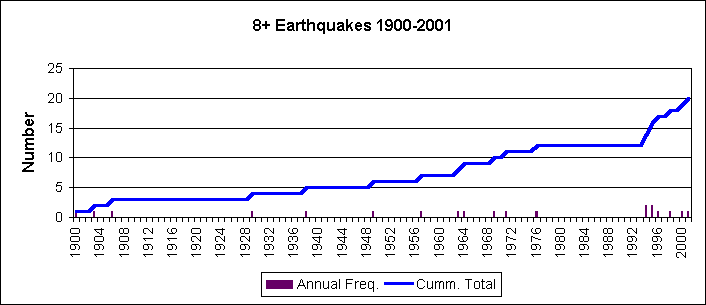
I have been having another look at the 8+ quake stats, this time from 1900, and a definite increase in the frequency of these size quakes is observed over the last decade. Note that, prior to 1994, 8+ earthquakes had only occurred in consecutive years once before. I can hear the scientific explanations now ...
This is clearly an indication that there is better data collection now and the continual improvement in seismic monitoring observed demonstrates just how effective those tax dollars are in the hands of the establishment. Not hing to worry about here, just continual improvement in monitoring standards." and "No, actually there is no baseline established for "normal" so we can not infer anything from this apparent trend. The reference period is insufficient and we really need 10,000 years of data before we can infer anything at all. Certainly the bunching up of lines on the right hand side of the graph is nothing to worry about.
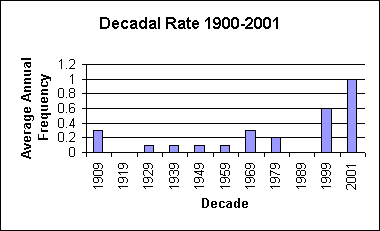
And here's another way of looking at it, the average annual number of 8+ quakes over each decade of the last century. The 2001 number is the annual average occurrence so far this decade (ie. for 2000 and 2001). The raw data I extracted is from the CNSS database for the period 1900 - 2001. The search parameters were:
a.. catalog=CNSS
b.. start_time=1900/01/01,00:00:00
c.. end_time=2001/07/15,00:00:00
d.. minimum_magnitude=8
e.. maximum_magnitude=10
f.. event_type=E


Offered by Gino.